🚀 Don’t miss out: Follow Dealsletter on X for all the latest platform news, and connect with our founder to see the vision behind the properties!
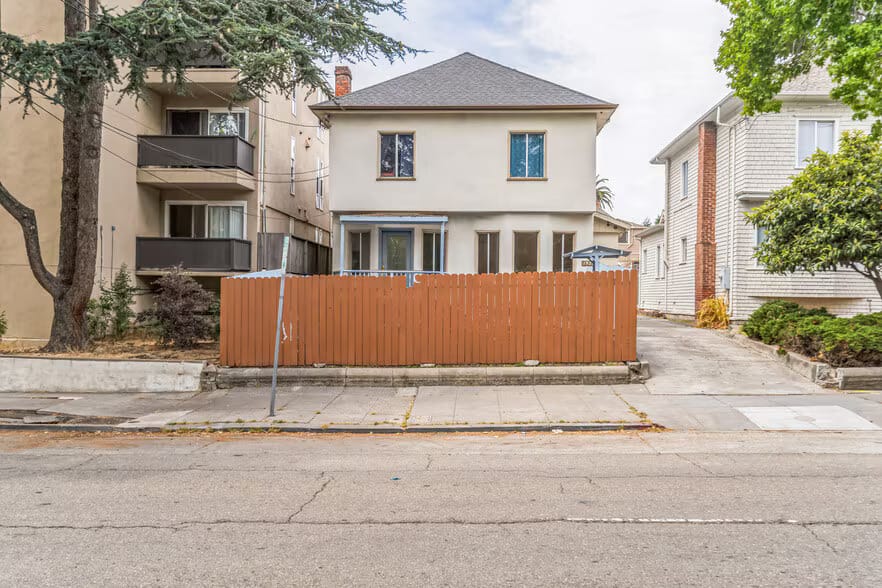
Berkeley Duplex House Hack - PREMIUM LOCATION WITH WEALTH-BUILDING FOCUS
📍 Address: 1921 Dwight Way, Berkeley, CA 94704
💰 Price: $1,295,000 ($647,500/unit)
🏠 Property: 1906 Classic Duplex (2x 3BR/1BA), 2,163 SF
🏦 House Hack Strategy: FHA 3.5% Down | 5-Year Return: 369%

Why This Requires Realistic Assessment:
Berkeley duplex near UC campus offering wealth building through equity accumulation but requiring premium over market rent. With FHA 3.5% down payment of $77,700 and monthly out-of-pocket of $5,135 versus $4,200-$4,800 market rent for comparable 3BR units, investors pay $335-$935 monthly premium. However, the combination of mortgage principal paydown ($2,300/month), appreciation ($3,200/month), and tax benefits ($700/month) creates true monthly cost of just $2,135.
This represents forced savings disguised as housing cost - wealth building for patient capital.
House Hack Analysis (3.5% FHA Down) 📝
Investment Metrics | |
|---|---|
Purchase Price | $1,295,000 |
Down Payment (3.5% FHA) | $45,325 |
Closing Costs | $32,375 |
Total Cash Required | $77,700 |
FHA Rate | 5.949% |
Monthly P&I + MIP | $8,037 |
True Cost Analysis 🚀
Monthly Housing Economics | |
|---|---|
Total Monthly Payment | $9,635 |
Rental Income (Unit 1) | $4,500 |
Apparent Cost | $5,135/month |
Market Rent Comparison | $4,200-$4,800 |
Premium Over Market | $335-$935/month |
Hidden Benefits Calculation | |
|---|---|
Monthly Principal Paydown | $2,300 |
Monthly Appreciation (3%) | $3,200 |
Tax Benefits | $700 |
True Monthly Cost | $2,135 |
5-Year Wealth Building 💰
Long-Term Equity Creation | |
|---|---|
Initial Investment | $77,700 |
5-Year Principal Paydown | $147,000 |
5-Year Appreciation (3%) | $209,500 |
Total Equity Year 5 | $364,261 |
Total Return | 369% (73.8% annually) |
Critical Success Factors:
Must stay minimum 5 years for returns to materialize
Berkeley rent control caps annual increases (but protects as owner)
1906 building requires $10-15K maintenance reserves
Need $200K household income to qualify comfortably
Business news doesn’t have to be boring
Morning Brew makes business news way more enjoyable—and way easier to understand. The free newsletter breaks down the latest in business, tech, and finance with smart insights, bold takes, and a tone that actually makes you want to keep reading.
No jargon, no drawn-out analysis, no snooze-fests. Just the stuff you need to know, delivered with a little personality.
Over 4 million people start their day with Morning Brew, and once you try it, you’ll see why.
Plus, it takes just 15 seconds to subscribe—so why not give it a shot?
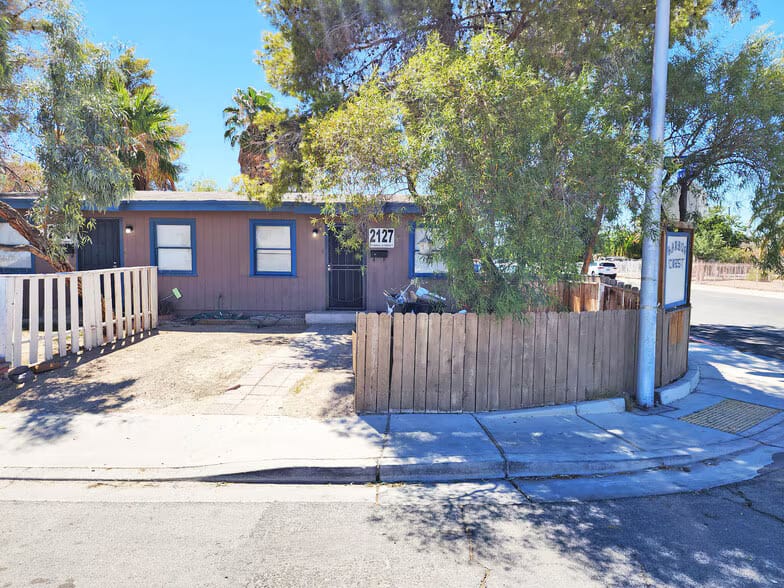
North Las Vegas 22-Unit Portfolio - 12% COC WITH AGGRESSIVE RENT STRATEGY
📍 Address: 2105-2125 Donna St, North Las Vegas, NV
💰 Price: $3,400,000 ($154,545/unit)
🏢 Property: 22 Units (Mix 1BR/2BR/3BR), Just Renovated 2025
🏦 Current Cap: 6.14% | Aggressive Strategy Cap: 9.06% | CoC Potential: 11.95%

Why This is a Great Investment:
Freshly renovated 22-unit portfolio with massive rent upside - current rents are 20-25% below true market! While seller's 6.69% cap rate uses optimistic assumptions, even conservative 6.14% represents solid foundation. The real opportunity lies in systematic rent increases: current average of $1,310/month can reach $1,600+ within 24 months as North Las Vegas continues explosive growth trajectory (30%+ rent appreciation since 2020).
This represents the perfect scale for individual investor with clear value-add roadmap.
Investment Analysis (25% Down) 📝
Investment Metrics | |
|---|---|
Purchase Price | $3,400,000 |
Down Payment | $850,000 |
Closing Costs | $68,000 |
Total Cash Required | $918,000 |
Current NOI | $208,804 |
Annual Cash Flow (Year 1) | $10,348 |
Current Cash-on-Cash | 1.13% |
Aggressive Rent Push Strategy 🚀
Current vs Market Rent Analysis | |
|---|---|
Current 1BR Average | $1,250-$1,300 |
True Market 1BR | $1,600-$1,700 |
1BR Upside | $300-$400/unit |
Current 2BR Average | $1,350 |
True Market 2BR | $1,800-$1,900 |
2BR Upside | $450-$550/unit |
Stabilized Performance (24 Months) | |
|---|---|
New Average Rent | $1,600/unit |
Annual Gross Income | $408,456 |
Stabilized NOI | $308,146 |
Annual Cash Flow | $109,690 |
Stabilized Cash-on-Cash | 11.95% |
5-Year Wealth Creation 📈
Conservative Hold Strategy | |
|---|---|
Year 5 NOI | $348,000 |
Year 5 Value (6.5% cap) | $5,353,846 |
Total Appreciation | $1,953,846 |
5-Year Cumulative Cash Flow | $350,000 |
Total Return | $2,303,846 (251%) |
Key Execution Requirements:
Raise rents 10-15% on turnover (Year 1)
Push remaining units to market (Year 2)
Professional property management essential
Renovations complete eliminate capex risk


